| |
| |
Quick Bid - 02.06.05 The Markups Tab - Overview Graph - QB
| Views: 459 Last Updated: 11/04/2024 01:23 pm |
0 Rating/ Voters
|
 |
| Be sure to rate this article 5 Stars if you find it helpful! |
The Overview Graph gives you a visual representation of the breakdown between Material, Labor, Equipment, Subs, and Other expenses for the Bid (if the Bid is highlighted in the Section list, as in the screen shot below) or for an individual Section.
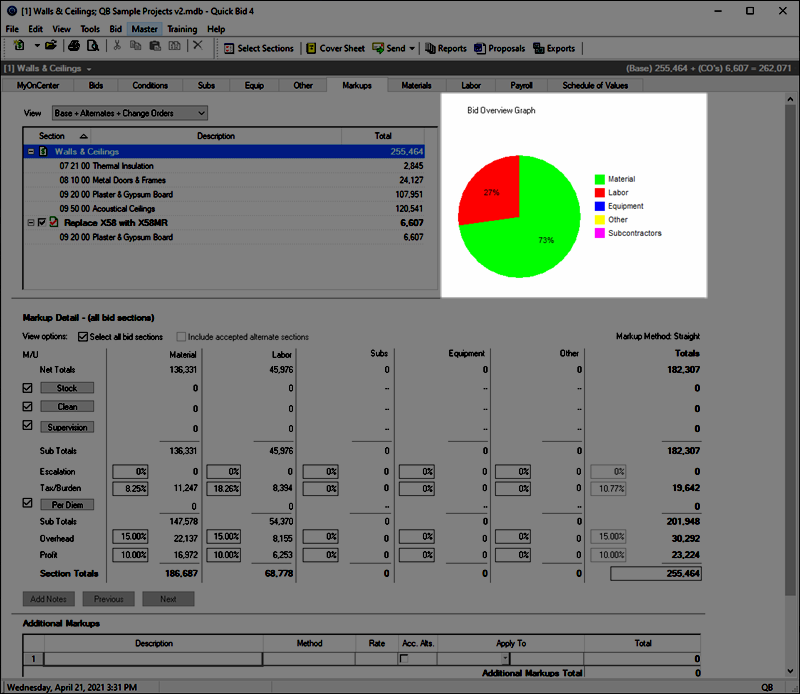
The Overview Graph allows an estimator to quickly (visually) check the "Labor Risk" associated with the Bid and each Section.
|
| |

 The Markups Tab - Additional Markups